Key Drivers Analysis is a powerful approach for understanding why consumers do what they do. However, Key Drivers is not a single technique. It is a category of techniques that must be thoughtfully selected based on objectives and data structure. Picking wisely can mean the difference between optimal use of your marketing and product resources or misallocation of those resources.
Your organization is likely to use Key Drivers Analysis to answer questions about brand performance, customer satisfaction, and purchase behavior. The vast majority of Key Driver studies use a standard linear regression model. But there are shortcomings to these models, and are not the most appropriate technique in some situations.
Standard linear regression models guide you in understanding the causal relationship between attributes. That is, we can identify the attributes that cause changes in preference, satisfaction or visitation. However, some standard linear regression models can lead your team to focus on the wrong attributes.
1. Multicollinearity
2. The need for individual vs. group level results
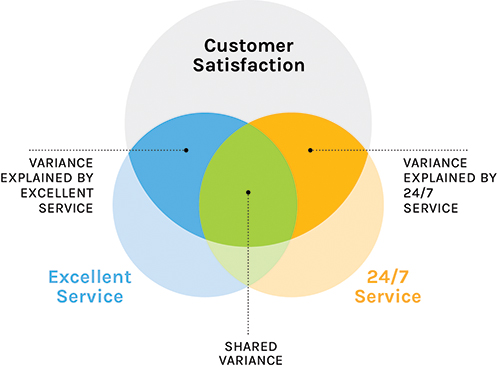
Multicollinearity refers to a situation in which two or more predictor variables are highly correlated. For example, if we are researching customer satisfaction and we have attributes such as Provides Excellent Customer Support and Provides 24/7 Service. In all likelihood, many customers who evaluate a brand as providing 24/7 support will also evaluate that brand as providing excellent customer support. Note, these are not necessarily the same thing, but they are highly related.

In the figure above, we have two highly correlated variables (Excellent Service and 24/7 Service), predicting Customer Satisfaction. The blue area represents the small amount of variance explained by Excellent Service only, while the yellow area represents the small amount of variance explained by 24/7 Service only. The large area in green represents the portion of Customer Satisfaction that is explained by both predictors.
In this scenario, the model does not know how to assign the green area that is shared. As a result, both predictor variables may show up as non-significant variables because of the small area of unique variance predicted, and we’d miss a key insight. This scenario is common. The telltale signs are a model which explained a lot of variance (the R2 is calculated based on the area in blue, yellow and green), but without many statistically significant predictors.
Linear regression does not account for high levels of multicollinearity and, as such, can lead to an incorrect estimation of the importance of attributes. This can lead you to invest time and energy into the wrong things.
This traditional technique identifies overlapping concepts (in our example, “Service”) and combines them into a composite variable that can be used in a regression. Factors are created in such a way that they are uncorrelated. Therefore, the multicollinearity issue is non-existent. The downside is that we are now dealing with factors rather than individual attributes.
Why don’t we always use Factor Analysis? While factor analysis is effective at dealing with multicollinearity, it changes our predictors from individual attributes to groups of attributes. So, we no longer have a unique impact of Excellent Service. We have an impact of Service as an overall concept.
This variant of regression is designed to specifically deal with multicollinearity. The process is complex, but the idea is that the relationship between the predictor variables is reduced (or removed) by manipulating the covariance matrix. The details of this are not particularly important for most researchers. But, the outcome is that we are able to estimate a linear regression using individual attributes in a way that we can estimate the unique impact of each attribute without concern for overlapping variables.
Why don’t we always use Ridge Regression? Ridge Regression is a flexible technique that can be used in a wide variety of circumstances. However, it does manipulate the covariances between the independent variables. If this is not necessary, then we should not be applying this data manipulation process.
In order to deal with correlation among the predictor variables, the Shapley Value approach runs multiple iterations of the model and combines them into a single set of drivers. It does this by creating different combinations of the predictors. So, if we have 3 predictors, we end up with 7 models:

From these 7 models, we can ascertain the impact of each predictor based on its average impact across each model for which it is included.
Why don’t we always use Shapley Value? This analysis can typically only be used for relatively small models. In the example above, we have just three predictor variables and a total of 7 separate models. With a moderate sized model with 10 predictors, the total number of models is 1,023.
The idea behind Latent Class Regression (LC-Regression) is that there are different, hidden groups within our sample that have different sets of key drivers. LC-Regression simultaneously segments our data and estimates separate key drivers models for each segment. The benefits of LC-Regression are:
a. Separating out the drivers by group can reduce the amount of multicollinearity that is present in our data, thereby allowing us to understand independent effects of each predictor variable.
b. Provides an understanding that some consumers make choices for different reasons than other consumers.
Why don’t we always use LC-Regression? LC-Regression requires multiple data points for each respondent in order to truly understand the differences in why some respondents have particular drivers while others have a different set.
Want to discuss more about which technique is right for your Key Drivers Analysis?
Stay on top of the latest marketing trends and innovative insights approaches.